Categories
Analytics

Data science, a role that transforms
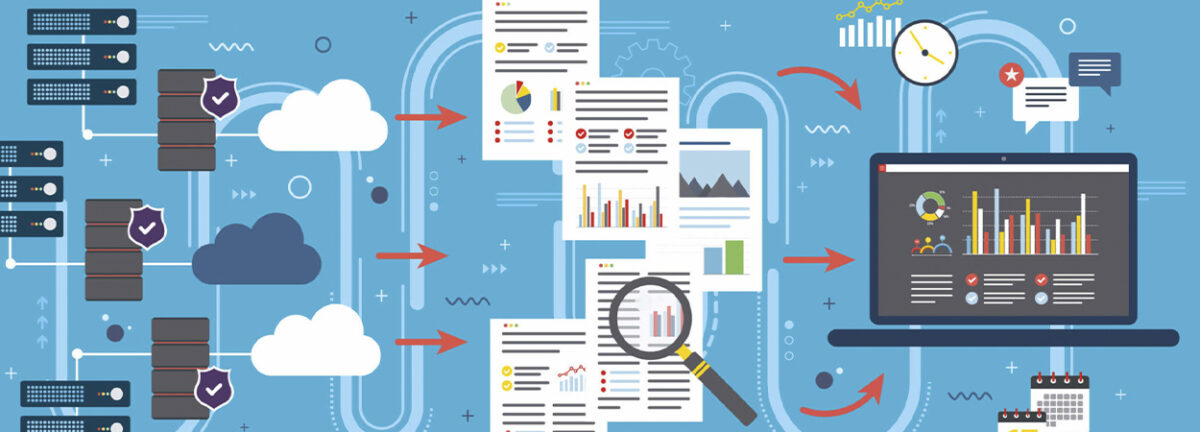
The world moves at great speed and companies are called to keep pace. Data science is the discipline that makes figures and algorithms an input to know the audience, innovate and optimize expenses.

What should companies do to get to know their customers better? What are the numbers provided by social networks and websites used for? Can a shopping strip become a source of information? Data science is capable of answering these and other questions related to the analysis of information as an input for making decisions.

This science unites disciplines that have been developed decades ago with new ways of reading the environment. It takes knowledge and techniques from mathematics, including statistics, systems engineering, and business intelligence to support data analysis with more advanced algorithms such as Artificial Intelligence,  Machine Learning  , and  Big Data . This multidisciplinary perspective breaks the scheme that the figures are only hard and pure data that concern certain areas of the company, to make them soft, useful and easy to interpret.

One of the great challenges of the data scientist is that his work is based on ethics and that the information collected does not put the privacy of users at risk.

According to Roberto Carlos Hincapié Reyes, PhD in engineering and dean of the School of Engineering at the Pontifical Bolivarian University, data science  “allows us to analyze combinations of a large amount of information and find patterns and relationships that are not simply visible.” .  Data science is what makes it possible to extract new data and information from that knowledge so that companies make decisions based on them.”

In organizations, data science has a very broad field of application that focuses on going beyond a correlation to find a causality. To understand it better, a data scientist has the training and criteria to understand and explain, for example, why when the dollar rises, the price of oil falls and vice versa or why if someone buys a few cans of beer, cheese and ham matured, you may be interested in acquiring a state-of-the-art television to watch a good soccer game. In both cases, the figures allow us to understand behaviors derived from them.

Why should companies add a data scientist to their workforce?

  • To have greater financial efficiency, optimize resources and find new investment alternatives.
  • Because it allows us to understand that the data historically stored in an organization, more than files, is an intangible that can become a monetizable value.
  • It allows us to get to know and get closer to customers, offer them solutions tailored to their tastes and needs. This represents higher income and loyalty.
  • To turn data into clear and understandable information for an organization.
  • It is essential to identify consumer habits and trends and create strategies that respond to them.

The world has understood that the functions of the data scientist can write a before and after in organizations. The challenge for those who are attracted to this discipline is to train not only in fundamental areas, that is, mathematics, algorithms, computing and data processing, but also in humanism, as an ethical call.

Source:  Roberto Caros Hincapié Reyes.
Electronic Engineer, PhD in Engineering
Dean of the Engineering School of the Pontifical Bolivarian University

Categories
Analytics

The content of value for the right person

Mazda, Anthropologie and Red Bull use, in these unique success stories, knowledge and segmented communication as a winning factor in their marketing strategy. Find out what they did and what transformed the conventional customer-brand relationship.

In the world of marketing, the challenge is not only to reach the target market, but also to reach the target audience; The success of a relevant value proposition for your client lies in the segmentation, and in the knowledge of this, of their demographic data, but also of their consumption habits, tastes and behavior, is the effectiveness of communication and ultimately of the sale.

Under this logic, the  Mazda subsidiary in the United Kingdom developed an intelligent advertising strategy on the Internet that suggested the  test-drive  of one of its models according to the user’s profile when doing a Google search. This profiling also allowed Mazda to match potential buyers with the actual inventory of its dealers in a radius close to the user. This meant an increase in sales of 98% more compared to regular sales, as well as a 20% increase in the participation rate of their advertising.

For its part, the Anthropologie chain publishes a series of easy-to-prepare cocktail recipes on its blog. These recipes are shared according to the season, for example soft drinks in summer and hot drinks in winter. This is done not only with the intention of hooking the audience, but also of establishing itself as a close, everyday brand that knows both drinks and fashion and that keeps abreast of the lifestyle trends of its consumers.

Redbull  also teaches us many lessons. This is one of the pioneering brands in creating relevant content for its consumers and it does so from a TV channel (Red Bull TV) to sponsoring activities related to extreme sports, competitions, concerts and even has digital magazines like The Red  Bulletin . Thanks to a complete content strategy, the brand is positioned today as a leader in large markets, achieving sales three times greater than its closest competitor. In fact, in 2007 Red Bull founded Red Bull Media House, a content agency that is responsible for selling original content created by Red Bull to other brands.

Categories
Analytics

Artificial intelligence and data: the challenges

Where does the data go? Many keys to the future lie in the ability to capture, process and understand them. Artificial intelligence is a predictive tool and it is already here.

As intelligent learning systems ( machine learning ) become more sophisticated and precise, they become great allies for data processing. Business Intelligence (BI) processes have gone from being aesthetic and inflexible reports to interactive systems in which information can be filtered, and understand why and how certain events happen. These systems are still under development, and companies like Google, Microsoft or IBM are currently working on various challenges to take them to the next level. Here we present some of them.

Cost:  Artificial intelligence (AI) systems have begun to generate automated reports that include data analysis. According to Yseop, a company that develops AI systems, their cost will be reduced by 77% once their use becomes widespread.

Lack of experts:  in the US alone, almost 200,000 professionals capable of analyzing data are needed and close to 1,500,000 analysts who are capable of making decisions based on analyzed data. Artificial intelligence systems will replace these professionals and they will take more active roles in companies.

Predict:  AI systems are primarily focused on predicting based on analyzed patterns. Although algorithms of this type are already on the market, the Magic Quadrant predicts that by 2018 these systems will be active in more than 50% of the world’s large companies and conglomerates.

Recommend:  According to Herain Oberoi of the Microsoft Analytics team, the final frontier of AI and Business Intelligence is the ability to make recommendations based on predictions. This will not only be done in a proactive way by the system, but through natural interactions between the user and the machine.

Categories
Analytics

Big data, what the data gives us

Today’s best big data strategies begin to take action in real time. The results are amazing.

The most recent advances in the area of  ​​big data  do not cease to amaze us: optimization of industrial processes, efficient decision-making in government, and an unprecedented level of insight into consumer shopping habits. Department stores such as Macy’s, Kohls, and Target are using real-time analytics models to predict and monitor their customers’ buying habits.

This monitoring extends from social networks to visits to points of sale. For example, Kohls piloted several of its stores, where she sent personalized offers using text messages and  emails . customers who were inside the store, with excellent results. It is clear that this type of promotion stimulates the purchase at the moment in which the consumer is at the point of sale. Macy’s also has a real-time strategy whereby it sends coupons and promotions to its customers who decide not to execute a purchase at the end of their website visit. In this way, the consumer is invited by the store to see the product physically and thus stimulate and close the purchase. On the other hand, Target uses the analysis of “Emotional data in social networks” to understand the reactions of its consumers to new products and predict their success.

One of the most important tennis tournaments, the   Wimbledon Grand Slam, together with IBM, developed a real-time monitoring system that analyzes everything from the speed of the ball to the comparison of historical data for each match, as well as comments on social networks and observations of sports experts. In this way, although the tournament is attended by a few hundred people, the more than 800 million followers of the Grand Slam receive enriched information in real time via the Internet and television. According to IBM, more than 850,000 data points including 600 matches are analyzed during the tournament and interpreted by a team of 48 data analysts.

Categories
Analytics

View data to make decisions

Reports gain exponential value when graphed. Get to know the Smart Visual so you don’t get lost in a sea of ​​data.

1

What is Smart Visual Data?  It is a tool that reinterprets  business software  to change the presentation of data, taking information from various sources to capture on one screen or several ( videowall ) a complete overview of the business and the sector in real time and with attractive, simple and intuitive graphics. .

2

How can Smart Visual Data help my business?

  • Sort, rank and prioritize the most important data.
  • It crosses various sources of information to speed up decision making.
  • Visualize the fulfillment of commercial or strategic objectives.
  • Keeps work teams informed, motivated and integrated.
  • Project an image of transparency and innovation.
  • Generates reliable and real-time information.
  • It provides the ability to predict future problems.
  • It is the next and logical step of  Big Data and Smart Data .

“With Smart Visual Data, companies have greater control and have the data constantly in view, so that, consciously or unconsciously, they are always analyzing it. And, most importantly, they are getting it.”

Majo Castillo,
Director of Operations of the company Zeus, pioneers in the creation, development and implementation of this system in Spain.
3

How does it impact my business management?  The impact of Smart Visual Data varies greatly and depends on several factors. There are clients who install it to improve business management, increase their sales in a specific territorial area, increase conversion indicators with clients or optimize the organization of tasks and projects in a specific department. However, and as an example,  it is estimated that a business can reduce the control times of its  stock , going from 3 hours to 10 minutes .

Smart Visual Data conveys emotion and facilitates making the right decisions at the right time.
4

What requirements must I meet to install this tool in my business?  Smart Visual Data is the natural evolution of analytics towards processes where people prevail. It creates a management system that, far from creating tedious reports and complex graphics, facilitates decision making. The only requirement to have it is to generate enough data in a  software  or even in an Excel file, ERP (resource planning systems) or CRM’s to ‘paint’ them in a control panel, in such a way that they show the living history of the company.

5

What are the implementation phases?  It is made to measure after defining which indicators are most important to display. Part of a knowledge stage to get to know the business and the communication flows well; Subsequently, the KPI’s (key performance indicator) are established, the technological connection to the sources is made and finally or in parallel, the programming and design of the graphics or  dashboards are carried out .


To learn more about Smart Visual,  watch this video